

What's trending
A mixed year for Northland shoppers
Retail spending is one of the helpful indicators of how the economy is tracking. It shows how much households feel able and willing to spend, and it also matters for employers.
Retail is a significant part of Northland’s economy, accounting for around 9 percent of filled jobs and supporting activity in other sectors such as transport and wholesaling.
Retail spending in Northland increased slightly in 2025, but rising prices mean households are still spending less in real terms than they were three years ago.
What we’re seeing
Retail spending in Northland reached $3.8 billion in the year to December 2025, up 2.3 percent on 2024. This is the first meaningful increase after three years of very little change.
However, when adjusted for inflation, retail spending was 0.5 percent lower than in 2024. Real spending has been falling steadily since 2022 and remains 3 percent below where it was three years ago.

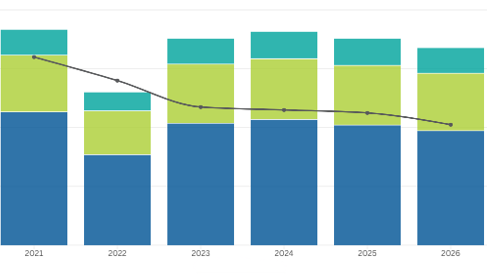
Retail spending has grown steadily in dollar terms, but when adjusted for inflation the trend has been declining since 2022, showing that households are getting less for what they spend.
What’s influencing this
Higher prices continue to shape household spending decisions. Many Northlanders are prioritising essential purchases and reducing discretionary spending.
Relatively high interest rates are diverting more household income toward debt repayments, and a softer labour market is making people more cautious.
How Northland compares

Only a few regions saw real retail growth in 2025.
Northland’s pattern mirrors the national trend. Only seven of sixteen regions saw any growth in real retail spending in 2025, with Otago and several South Island regions leading gains due to strong tourism. A large rise in international tourists visiting Queenstown contributed to the big increase for Otago.
Six regions recorded larger declines than Northland, with Gisborne and Manawatū-Whanganui recording declines of more than 2% in 2025.
Retail spending in real terms has grown since 2022 in only two regions nationwide: Otago and the West Coast.
Northland’s three‑year decline is similar to the national average and smaller than the falls seen in Manawatū‑Whanganui, Waikato and Hawke’s Bay.
Auckland continues to dominate national retail activity, accounting for almost 40 percent of spending across the country.
What to watch next
The conflict in the Middle East, beginning in early March 2026, is likely to place further pressure on household budgets.
In 2024, there were 160,000 light vehicles registered in Northland, with each doing an annual distance of 12,000 kms.
Using the national average petrol passenger vehicle fuel consumption estimate of 8.4 litres per 100kms, a 50-cent increase in fuel prices over a full year would equate to an additional $500 spent on fuel (assuming distance travelled remains the same).
Multiplying this extra cost by the number of light vehicles suggests an additional $80 million on annual fuel costs for Northlanders, equal to around 2 percent of total retail spending in 2025.
Higher fuel costs will influence household choices and may slow retail activity further in the year ahead.
What's changed
Forestry’s year in review: Not always a walk in the woods
Forestry remains a mainstay of Northland’s economy, contributing around 3 percent of regional GDP and close to 20 percent of export earnings. It spans the full value chain, from forest management to harvesting and processing. But as the graph below shows, it hasn’t always been a walk in the woods. GDP and export values have lifted and dipped across the decade, with 2025 sitting close to 2014 levels. Activity is steadying, but pricing and margins are yet to fully recover.

Forestry and wood processing GDP has softened from its 2019 peak.
Year in review for the forestry cycle
The forestry cycle has been softer nationally and in Northland. National harvest volumes fell from 36.5 million cubic metres in 2019 to 33.1 million in 2024 as export demand and domestic processing eased. These trends are visible locally through lower cut levels and tighter margins.
Late 2025 brought some stability, with domestic conditions and export volumes improving, but the lift was not enough to move margins in a meaningful way.
Activity is steadier, but prices are still soft.
Market dynamics: where the pressure is coming from
Demand at home is influenced by the building cycle. Dwelling consents peaked in 2021–2022 before dropping sharply through 2024 and 2025, reducing demand for structural timber and weakening wood product activity.
A late‑2025 rebound helped clear some lines but was more stabiliser than reset.
Offshore markets: China still sets the pace and offshore headwinds weighing on returns

China has dominated Northland’s wood export volumes for more than a decade, with total volumes easing after their 2017–2019 peak.
China remains the anchor market for Northland exports. Its dominance strengthened after Covid‑19, while India’s share softened due to demand and fumigation‑related disruptions.
An interim solution has supported a slight rebound, but China still sets the tone.
When China’s construction slows, Northland feels it through lower cut levels and tighter margins.
Slower construction and property demand alongside an 8.4 percent fall in China’s log imports kept buyers cautious in 2025.
Higher shipping costs into China and flat A‑grade radiata log prices further squeezed at‑wharf returns.
This is felt across all markets with freight and trade frictions adding another layer of complexity and there is no indication of this slowing with recent events.
Global rerouting around the Red Sea throughout the year has tightened vessel capacity and lifted freight and bunker costs, adding more pressure to Northland exporters.
India: trade missions now, tariff cuts next
India is starting to re‑emerge after a softer post‑Covid period, further impacted by market access requirements.
Trade missions in 2025 helped rebuild ties, and the New Zealand–India Free Trade Agreement — now moving through approval — will remove tariffs on more than 95 percent of forestry products entering a market of 1.4 billion people.
This not only potentially improves price points for logs but opens opportunities for higher value processed wood products.
For processors, the Whangārei chip mill is essential
The Marsumi chip mill takes pulp‑grade logs and sawmill residuals and turns them into export chips, preventing fibre from backing up when structural orders slow.
Chip exports are small compared to logs but have been one of Northland’s most consistent value streams.
The February 2026 purchase of Marusumi Whangārei by Nippon Paper Resources Australia and Pentarch, and the rebrand to NP Wood Fibre, secures a reliable pathway to Japan and wider Asia.
Without it, processors risked losing a key outlet for residues. With it, operational risks are reduced and fibre keeps moving.
What these changes could mean for Northland

Export values have softened since 2019 but planted forest area continues to rise.
Northland’s plantation estate is expanding and has now surpassed 2004 levels. Supply is not the constraint – capturing value is. With logs and China still dominating the export mix, offshore prices and freight determine returns.
Treasury’s view is unchanged – without more domestic processing, harvest volumes and export value remain capped.
Greater resilience depends on diversifying into value‑added exports.
A secure chip outlet and potential tariff‑free access to India provide two important foundations.
Together with a growing estate, these give Northland the conditions needed to begin shifting from a log‑heavy profile toward higher‑value processing.
In short, Northland’s forestry sector is steadying, but the next gains will come from value, not volume.
What's new
Northland’s economic activity: A closer look at the latest results
In the year to March 2025, Northland’s economic activity, measured by real GDP (constant 2025 prices), declined by 0.9 percent.
GDP (Gross Domestic Product) measures the value businesses add to their inputs of goods and services.
Real GDP adjusts for inflation to allow for meaningfully comparison over time.
Northland’s result was similar to the national picture, where New Zealand also recorded a fall in real GDP.
Thirteen out of the country’s 16 regions experienced a decline, including both urban and rural areas.
The largest falls were in Taranaki, the West Coast and Wellington.
Only Canterbury, Southland and Tasman recorded positive real GDP growth in 2024/25, with Tasman the highest at 0.8 percent.

Chart showing annual average GDP growth for New Zealand regions. It compares growth in 2024 to 2025 with average growth over the five-year period from 2020 to 2025. Tasman recorded the highest growth in 2024 to 2025, while Taranaki had the largest decline. Northland recorded a small fall in 2024 to 2025 and lower average growth over the five-year period. Source: Infometrics.
A broader national slowdown
Growth rates across all regions in 2024/25 were much lower than their annual averages over the five years from 2020 to 2025.
This wider slowdown reflects weaker household spending, which was influenced by relatively high interest rates and a softer labour market, and a drop in private investment.
Northland’s five-year performance
Northland’s average annual GDP growth over the five period was 0.1 percent, compared with the national average of 1.7 percent.
This placed Northland second lowest among New Zealand’s 16 regions, ahead of Taranaki.
Waikato, Canterbury, and Bay of Plenty recorded the fastest growth over this period at around 2.0% per year.
A major factor influencing Northland’s five-year result was the closure of the petroleum refining facility at Marsden Point in 2022.
When this is removed from the data, Northland’s GDP grew by 1.4 percent per annum over the five-year period.
This was like regions such as Gisborne, Manawatū Whanganui, the West Coast and Wellington.
Public sector services and their contribution
In the year to March 2025, the public sector dominated services industries, including education, health care, and public administration, made the largest positive contribution to economic activity.
Increased activity in this group of industries contributed the equivalent of a 0.3 percent increase in regional GDP.
There was little change in the contribution from Primary Industries or Manufacturing in 2025.
The closure of refining operations at Marsden Point resulted in a significant fall in Manufacturing’s contributions to Northland’s GDP over the five-year period.
It reduced GDP by 3.6 percentage points in the year ended March 2023. Equal to almost 400 million dollars.

Chart showing the annual contribution of industry groups to GDP growth in Northland. It compares industry contributions in 2024 to 2025 with contributions over the five-year period from 2020 to 2025. Public sector dominated services made a positive contribution in 2024 to 2025. Construction and infrastructure services made the largest negative contribution in the most recent year. Source: Infometrics.
Private sector services in the most recent year
Across the five-year period from 2020, private sector services were the largest contributors to overall growth in Northland’s economy.
However, this group experienced a decline in the most recent year.
This was partly due to lower retail spending and reduced activity in accommodation and food services.
Indicators suggest that consumer spending began to lift later in 2025 and into 2026. This may be linked to falling interest rates.
Construction and infrastructure activity
The largest fall in activity in the year ended March 2025 occurred in the construction and infrastructure services sector.
This trend is likely to have continued through the rest of 2025 and into 2026, reflecting lower levels of residential building consents, and to a lesser extent, non-residential building consents being issued.
The data used in this section comes from the Northland Regional Economic Profile produced by Infometrics.
The online profile is free to access and provides detailed information on Northland’s economic structure and performance.
It’s available in our Economic Development section
What's coming up
Northland’s energy shift: The rise of solar, wind and the Energy Bridge
New data from the Electricity Authority shows solar generation reached a national record of 128MW on 6 March 2025.
This is the highest level ever recorded in New Zealand. Just a few weeks earlier, between 22 and 28 December 2024, solar generation exceeded thermal generation for the first time.
It signals a real shift in the supply mix as large scale solar projects continue to come online[1].
Northland’s early leadership
While these records are national, Taitokerau has played a leading role.
Kohirā Solar Farm in Kaitaia, commissioned in 2023-24 as New Zealand’s first utility scale, grid connected solar farm now generates about 55 GWh each year.
Its commissioning kicked off a new investment cycle in the region.
That momentum is growing again with Meridian Energy’s major development in Ruakākā.
This is Meridian’s first grid scale solar project and will span 201 hectares, producing up to 230 GWh a year once complete.
It sits beside the 100 MW Ruakākā Battery Energy Storage System, which was commissioned in May 2025.
Together, these form one of New Zealand’s most advanced hybrid energy sites and strengthens Northland’s position as a leader in a clean energy transition.
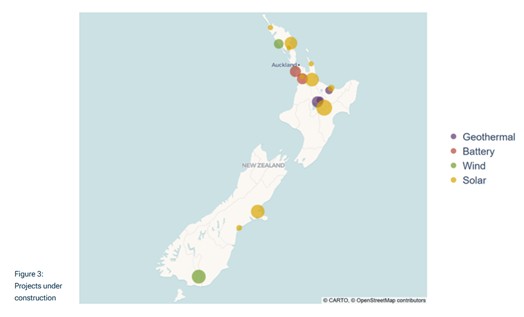
Private investment is scaling up
Across the country, the Electricity Authority's latest pipeline shows 293 proposed generation projects with a combined 45.8kMW capacity[2].
National growth matters locally. In Northland, private investment in new green generation is not only a climate response, but also part of a wider long-term economic strategy to lift resilience, attract industry, and anchor longer term growth.
New build decisions are moving from concept to construction, positioning the region to support local demand and contribute to the Upper North Island economy.
Building on this private investment momentum, Northland is pairing its solar strengths with new utility scale wind generation. Mercury’s first large scale wind project in the region – the Kaiwaikawe Wind Farm – is taking shape near Dargaville.
The company is investing $287 million to install 12 Vestas V162 turbines. At 206 metres, these will be the tallest structures in the country after the Sky Tower.
The site has a capacity of 77 MW and is expected to generate around 220 GWh a year, enough to power roughly 27,000 homes, with generation expected to commence mid 2026.
Up to 150 workers will be on site during peak construction and a long-term community fund will operate for the life of the farm.
Kaiwaikawe boosts grid resilience because Kaipara’s west‑coast winds behave differently from Manawatū and Southland.
This supports national supply when weather conditions diverge, and by sitting close to Auckland’s demand, helps reduce transmission losses.

Map of the Kaiwaikawe Wind Farm project area near Dargaville, showing turbine locations and the project boundary.
The bottleneck: transmission capacity
Private capital can only scale as far as the grid allows. Northland’s transmission constraints have been under scrutiny since the June 2024 tower failure that cut power to about 88,000 people.
It was a clear reminder of how maintenance or faults can compromise reliability when there is limited headroom.
The event sharpened attention on grid risk and highlighted why clear, timely connection pathways matter for new generation and energy intensive industries looking at Northland.
Under current settings, much of the cost of major upgrades risks falling on first movers and local consumers, even though the benefits extend across the Upper North Island. This creates a misalignment that can slow otherwise viable projects[3].
In the Far North, the export path back to Whangārei is effectively at capacity[4]. New generation cannot be approved without network upgrades or run back schemes paid for by connecting parties.
This restricts further Far North investment until new capacity is in place. National data also shows projects currently spend about 3.5 years in Transpower’s queue and about 4.5 years from queue to completion, underscoring why connection certainty is essential.
Energy Bridge: unlocking Northland’s potential
To address reliability issues and support future growth, Transpower, Northpower and Top Energy are advancing the Energy Bridge concept.
This is a coordinated package of transmission and distribution upgrades designed to connect Northland’s wind, solar and geothermal resources at scale.
It would also allow surplus power to be exported south when generation exceeds local demand.
The Energy Bridge builds on earlier Renewable Energy Zone work and shifts it into a shared, right sized infrastructure plan that lowers per project connection costs and reduces timing risk for developers.
The need is clear. In the Far North, Top Energy’s Kaikohe–Kaitaia 110 kV line is fully allocated and Transpower’s Kaikohe–Maungatapere 110 kV line is constrained under N‑1 conditions. In practice, this caps new Far North generation projects until more capacity is built.
Some government support has been provided. In April 2025, Ministers committed up to $2 million from the Regional Infrastructure Fund for MBIE to lead a feasibility and economic assessment of the Northern Energy Bridge with local partners.
The study tested investment options that could unlock up to $1 billion of private renewable development, strengthen regional resilience and, if feasible, enable staged new connections through to a potential full commissioning by 2029.
Proceeding with the Energy Bridge concept, including strengthening the Kaikohe–Maungatapere spine and relieving the Far North export constraints, would unlock new solar, wind and geothermal projects.
It would also support emerging Marsden Point developments with reliable clean power and make better use of the under utilised 220 kV capacity between Marsden and Auckland. The result would be fewer outage risks, room for new projects, a stronger investment proposition for electrified industry and better conditions for long term economic growth in Taitokerau.
Disclaimer: This e-newsletter provides general information on the Northland economy and the views expressed are those of the authors. It is not intended for any course of action nor as a substitute for financial advice.