

What's trending
Northland’s economy: adapting under multiple pressures
Recent events in global energy markets highlight how the economic environment that businesses operate in is becoming more complex and uncertain. Changes in oil prices, geopolitical tensions and supply disruptions are increasingly occurring at the same time.
This experience is not new for Northland; it reflects a longer-standing feature of how the regional economy functions.
Over the past five years, the region has experienced a series of significant events, including COVID 19, the closure of the Marsden Point refinery, Cyclone Gabrielle, and renewed volatility in global commodity and fuel markets. Rather than occurring in isolation, these impacts have often overlapped, amplifying their effects.
Layered and overlapping pressures

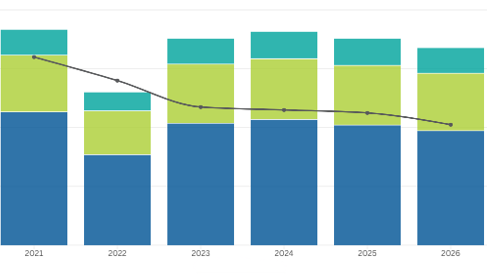
Growth in Northland economic indicators shows the cumulative impact of overlapping disruptions since 2000
Over time, Northland’s growth across GDP, employment and business activity has been interrupted by a range of events, including:
- market-driven changes such as commodity cycles
- environmental shocks such as droughts and Cyclone Gabrielle
- policy and structural changes such as COVID 19 and the refinery closure
These disruptions often occur close together, with new pressures emerging before earlier impacts have fully worked through.
As a result, the region is not moving through clearly defined cycles of downturn and recovery. Instead, it is continuously adapting to changing conditions over an extended period.
From growth to performance under pressure
Traditionally, regional economic performance has been assessed through growth – how quickly output, jobs, and productivity expand.
More recently, the focus has shifted toward how economies perform under pressure.
Economic resilience, in this context, refers to the ability to absorb disruption, maintain activity, and adapt over time.
In Northland, this pressure rarely comes from a single source, reflecting both the region’s economic structure and the way different disruptions interact.
Where Northland is most exposed
Three factors are particularly important:
1. Sectoral structure

Major sectors appear similar in scale to the national economy, but Northland shows stronger reliance on primary industries and locally driven activity.
Northland’s economic structure plays a key role in how disruption is experienced.
At a high level, the region’s largest sectors appear relatively balanced, but two features stand out:
- There’s a strong reliance on the primary sector and related manufacturing.
About 3% of manufacturing activity (out of a total 8.3%) comes from processing primary products such as meat, dairy, and timber. This shows how closely manufacturing is linked to these sectors.
This concentration has increased since the closure of the Marsden Point refinery, which previously made a significant contribution to manufacturing GDP. In 2020, manufacturing accounted for around 17.5 percent of GDP. The loss of refining has reduced diversification in the sector.
- Many of the largest sectors, such as healthcare, real estate services and construction, are driven by internal activity, such as population growth and local demand rather than outward-facing, productive activity
When compared to New Zealand averages, Northland has:
- greater reliance on land-based industries
- a smaller and less diversified manufacturing base outside primary processing
- a higher share of activity driven by local demand
2. Export concentration and commodity exposure
The dominance of the primary sector and associated manufacturing also flows through to exports, with close to 70 percent of Northland’s export value generated by these sectors.
This creates a direct link between international commodity prices and regional income. Over time, changes in global prices tend to directly impact Northland’s export performance.

Changes in export growth align with shifts in key primary-sector commodity prices, highlighting Northland’s exposure to global markets.
Prices are the primary driver, but supply chain factors can also influence outcomes. During COVID 19, for example:
- congestion at international ports meant goods were held offshore or remained unloaded, delaying sales and reducing demand for exports
- shipping disruptions increased costs and reduced reliability
More recently, changes in global freight routes have added further cost and uncertainty. As a result, Northland’s exposure relates to both global demand and the reliability of supply chains.
3. Connectivity and Infrastructure
Northland relies on a relatively small number of key transport routes and energy connections. This increases infrastructure vulnerability compared with many regions, due to limited alternatives and geographic isolation.
As shown in image 1, this is reflected in a recent analysis undertaken by NZIER, where Northland was ranked as one of the most vulnerable regions when it comes to infrastructure resilience.
COVID 19 highlighted this through restrictions on movement and access into the region. Tourism activity was affected over a longer period due to Auckland lockdowns. This reflects the region’s reliance on domestic tourism, with reduced demand and disruption to labour and supply chains.
Cyclone Gabrielle reinforced these challenges, with:
- disruption to key freight routes, including the Brynderwyn Hills
- damage to sections of the North Auckland rail line
- broader impacts on the movement of people, goods, and services
With few alternative routes, these disruptions affect multiple sectors at once.
Both events triggered a strong infrastructure response, resulting in a temporary lift in construction activity within the region. As these programmes wind down, construction activity is softening, highlighting how recovery-driven growth can be short-lived.

A national comparison highlights Northland’s greater exposure, reflecting its reliance on limited transport and energy connections and fewer alternative routes.
What this means in practice
Taken together, these factors point to a common set of conditions:
- pressures arise from multiple sources
- they often occur close together and are independent of each other
- their effects are felt differently across sectors
This helps explain why recent years have felt less like a series of separate events and more like a prolonged period of adjustment across the regional economy.
Looking ahead
While Northland remains exposed to these pressures, it’s also responding. Recent and signalled investment in infrastructure and connectivity, including water storage, transport links, rail, and health, is expected to strengthen the systems supporting the regional economy and improve its ability to absorb and respond to disruption.
There's also growing private sector interest in diversifying the region’s economic base and export profile, particularly in higher-value manufacturing and emerging industries.
These shifts point to clear opportunities to strengthen resilience by reducing reliance on a small set of sectors and connections.
The key question is how effectively this momentum will translate into a more diversified, connected, and adaptable regional economy.
What's changed
Understanding regional rates in Northland
Long-term trends in regional rates
Rates have been rising across regional councils for some time, with larger annual increases typically linked to the start of Long Term Plan cycles. Northland follows a similar path.
While rates have increased over the period, this trend is not unique to Northland and the overall pattern closely mirrors what is happening across other provincial regions.
Differences are modest year-to-year but become more apparent when indexed over a longer timeline.
Across the country, outcomes vary widely, between 2014/15 and 2024/25, rates revenue for NRC grew at an average annual rate of 12 percent. Northland tracks similarly over time to the Bay of Plenty and Hawke’s Bay.
Otago stands out with much higher average growth (15 percent per annum), while Horizons has been much lower (5 percent per annum), with Southland and Taranaki in between. Northland sits in the middle rather than at either end.

Rates have increased steadily across most regions over time, with Northland tracking closely alongside similar councils, particularly following Long Term Plan cycles.
How Northland rates compare across measures
Rates per person sit at around $275, placing Northland in the upper end of the comparator range alongside Southland, Hawke’s Bay, and Bay of Plenty. Rates per property shows a slightly different pattern, with Northland sitting well below these other regions at $533.
From a household perspective, Northland doesn’t appear materially more expensive than its peers.

Rates per capita and per rateable unit are broadly aligned with comparable regions, rather than standing out as higher.
The key difference is less about how much is charged and more about how councils are funded. Northland relies more on rates than most regions as an income source.
In 2024/25, rates made up around 60 percent of Northland Regional Council’s operating income, compared with about 45 percent on average across comparable councils. This means cost pressures are more likely to flow directly through into rates.
In regions such as Bay of Plenty and Otago, a greater share of income comes from other sources, including dividends and interest from port and infrastructure investments.
These help absorb some of the pressure. In Northland, those options are more limited, so rates play a larger role in funding ongoing activities.

Compared with other regions, a larger share of operating income comes from rates, with less from dividends, investment income, and other sources.
How geography shapes activities

Northland combines a large coastal area with a dispersed rural population and a smaller share of DOC-managed land, increasing the scale of locally delivered environmental management.
Understanding Northland’s position requires looking beyond population. Regional council services are driven largely by land, water, and environmental systems, rather than by resident numbers alone. It’s also important to recognise that councils don’t all deliver the same mix of services.
More urban-based regional councils, such as Otago and Bay of Plenty, tend to have a greater role in areas like transport and consenting, reflecting the needs of larger urban centres. This influences both expenditure patterns and funding requirements.
Northland has a relatively large land area, extensive coastline, and a dispersed rural population. This creates a more complex service footprint relative to the number of ratepayers.
Northland also has the highest proportion of coastal area among comparator regions, with around 58 percent of its total area classified as coastal. This adds complexity to environmental management, particularly across coastal, marine, and catchment interfaces.
Land ownership also matters
It helps explain why so much of this effort sits locally.
Northland has a smaller share of land managed by the Department of Conservation (DOC) than most regions.
In regions with larger conservation estates, some environmental management is funded and delivered by central government. In Northland, more of this responsibility sits locally, increasing the level of active management required.
The result is a stronger link between environmental services and local funding, with more activity within the regional council’s remit and more cost reflected through rates.
How does this translate to spending?
Measured on a per person basis, Northland is one of the lower-cost regions, with operating expenditure at the bottom of the comparator group.
When spending is viewed per square kilometre, Northland again sits toward the lower end of the comparator group. This reflects the challenge of spreading resources across a large and complex geography, rather than a lack of service activity.
A larger share of Northland’s spending is directed to environmental management, including freshwater, biosecurity, coastal monitoring, and land programmes. These activities are ongoing, labour-intensive, and linked to geographic factors rather than population.

Northland's spending sits at the lower end when measured per person and by area
Structural drivers of Northland’s position
Northland’s position reflects a combination of structural factors. Rates growth is broadly in line with other regions, but reliance is higher due to limited alternative revenue.
Service demand is driven by land, water, and environmental complexity rather than population alone, while a smaller conservation estate means more active management sits locally.
Together, these factors explain why Northland can appear different in the data, while still tracking broadly alongside the rest of the sector.
What's new
The region’s beef herd is shrinking – what's at stake for Northland
Northland’s beef cattle numbers edged down over the past year, continuing a longer-term decline that has been underway for more than a decade.
In June 2025, farms across the region carried 319,563 beef cattle, down 0.7 percent (around 2,300 head) from 2024.
While the annual change is small, it sits within a much bigger shift.

Fewer beef cattle and a shrinking share of the national herd highlight a long-term shift in Northland’s role within the industry
A steady decline over time
Beef cattle numbers in Northland have been trending downward since 2018, following a short period of recovery in the mid-to-late 2010s.
- Down 20 percent since 2018 (around 81,000 fewer cattle)
- Down 37 percent since 2008 (around 188,000 fewer cattle)
Earlier growth in the 2010s was driven by herd rebuilding after drought conditions in the early part of the decade. That recovery has now reversed.
The total is now at the lowest level recorded since the data series began in 1990.
How Northland compares
The regional trend differs from what’s happening nationally:
- New Zealand’s beef herd increased four percent in the year to June 2025
- the national herd now sits at 3.83 million (as of 30 June 2025)
Northland’s share has fallen to just over 8 percent, down from:
- 11 percent in 2018
- 12 percent in 2008
Since 2018, Northland has seen the largest decline of any region, both in absolute and percentage terms.
Over the same period, most other regions have expanded their beef herds, particularly:
- Canterbury
- Waikato
- Southland
Change in number of beef cattle by region, 2018-2025

The scale of Northland’s cattle losses since 2018 exceeds all other regions, reinforcing the pace of change in the local beef sector
What’s influencing the decline
Despite relatively strong beef prices, several factors are likely contributing to lower cattle numbers in Northland, including increased dairy grazing and land use change such as conversion to pine plantation.
These shifts suggest the decline is not just cyclical but reflects a broader change in land use.
Why it matters for Northland
Changes in herd size can have wider implications for the regional economy.
Lower cattle numbers may affect the long-term viability of meat processing in Northland, particularly at:
- Silver Fern Farms (Dargaville)
- AFFCO (Moerewa)
The number of people employed in these plants represents 12 percent of jobs in Dargaville and a whopping 62 percent of jobs in Moerewa.
Meat processing is an important employer in both townships and any sustained change in supply has the potential to flow through to employment and economic activity in these communities.
Greater reliance on dairy-origin stock
Northland’s beef system is also more reliant on the dairy sector compared to the rest of the country.
- Calves born to beef heifers and cows represent just over 20 percent of beef animals aged over one year in Northland, equivalent to roughly one replacement animal for every five in the herd.
- Nationally, this is closer to one in three.
This lower replacement rate means the regional herd is more dependent on external sources of stock, particularly from dairy-origin stock.

Calves born to beef heifers and cows represent just over 20% of beef animals aged over one year old in Northland – a replacement rate of one-to-five.
What's coming up
New trade deal with India: Opportunities on the horizon
New Zealand signed a Free Trade Agreement (FTA) with India on 27 April 2026, with implementation expected from 2027. The agreement provides preferential access to one of the world’s largest and fastest-growing markets.
At a national level, modelling shows the agreement has the potential to lift exports and economic activity over time. For Northland, the opportunity lies in how closely the region’s export profile aligns with the sectors expected to benefit most.
What the agreement includes
The FTA will see India remove tariffs on a wide range of New Zealand exports, including:
- Forestry
- Sheep meat
- Horticultural products such as avocados, blueberries, and persimmons
- New quota access for kiwifruit and apples
These changes are expected to improve returns for exporters over time, particularly in agro-food sectors.
National outlook
Economic modelling indicates that the FTA could:
- Increase New Zealand’s exports to India by:
- $340 million in 2027
- up to $1.3 billion by 2050
- Lift annual real GDP by:
- $135 million (0.03 percent) in 2027
- up to $658 million by 2050
Forestry and wood products, meat, and horticulture are expected to be the largest contributors, accounting for around 60 percent of the projected increase in export returns by 2050.
What this means for Northland
While Northland is not as export dependent as some regions, its export mix is closely aligned with the sectors expected to benefit.
The ratio of exports (goods and services) to GDP provides an indication of export orientation. The higher the ratio, the greater the share of economic activity linked to overseas markets (or international visitors in the case of tourism).
In the year to March 2025, the ratio of exports to GDP in Northland was 0.24, the same as the national average (Graph 12).
Southland has the highest export orientation, followed by Marlborough, Taranaki, and the West Coast.

Northland’s export intensity sits around the national average, despite a stronger reliance on primary sector exports
Nearly 70 percent of exports from Northland came from agro-food products, compared to 57 percent nationally (Graph 13).
Forestry, meat, and horticulture are particularly important – these sectors make up 40 percent of Northland’s exports, compared to 23 percent nationally.
This alignment suggests Northland is well positioned to benefit from improved access to the Indian market over time.

Northland’s export mix is more heavily weighted toward dairy, forestry, and meat, highlighting a narrower sector base than the national average
A closer look at the export profile
Northland’s export base differs slightly from the national mix:
- Tourism accounts for around 15 percent of exports, slightly below the national share (17 percent) a similar level to meat exports in the region.
Northland is below the national average in sectors such as:
- beverage exports (think Marlborough wine)
- industrial manufacturing
- non-tourism services
Potential impacts for the region
If national-level gains flow through proportionally, modelling suggests:
- Northland’s exports to India could be around $50 million higher per year by 2050
- This would represent a two percent increase in total export value
- Regional GDP could increase by around $40 million per year (around 0.3 percent)
It’s important to note that the modelling does not include the development of new supply chains into India. As current trade volumes are relatively small, new pathways are likely to emerge over time. As these develop, the economic impacts of the FTA may be larger than these estimates.
Disclaimer: This e-newsletter provides general information on the Northland economy and the views expressed are those of the authors. It is not intended for any course of action nor as a substitute for financial advice.