

July has seen winter set in with temperature variability and dominant westerly flows. The month has been significantly drier than average especially through the middle and south of the region. Te Puhi, Kaikohe, South of Whangārei, across the Kaipara extending to Pouto Point had well below average rainfall. With only Purerua Peninsula having above normal rainfall. River flows are generally low for July due to below average rainfall. With drier conditions and reductions in soil moisture, groundwater is getting less recharge and beginning to reduce levels.
Summary
- Northland’s average rainfall was 95mm which was 53% of expected rainfall for July
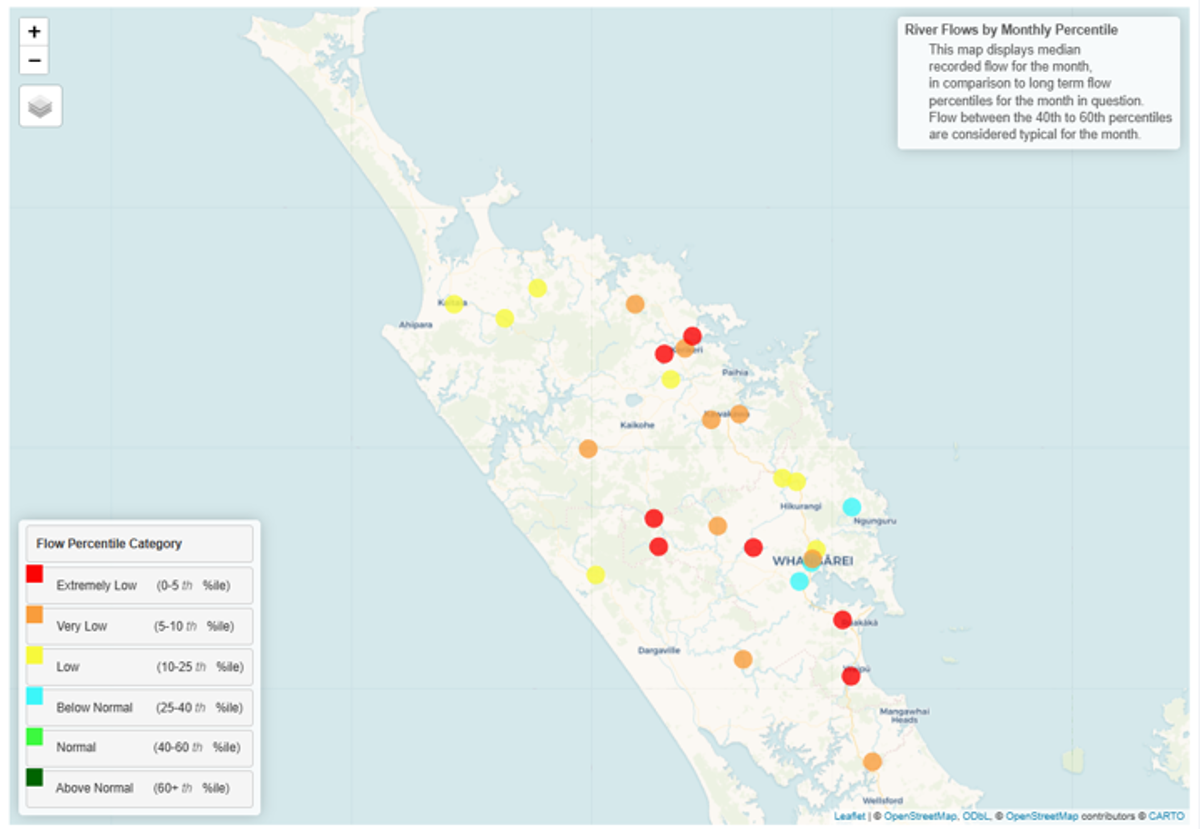
- River flows for Northland range from “below normal” to “extremely low” across the region. Primarily “low” to “very low”. River flows are generally lower through the middle and southern parts of the region, reflecting July’s lower rainfall distribution.
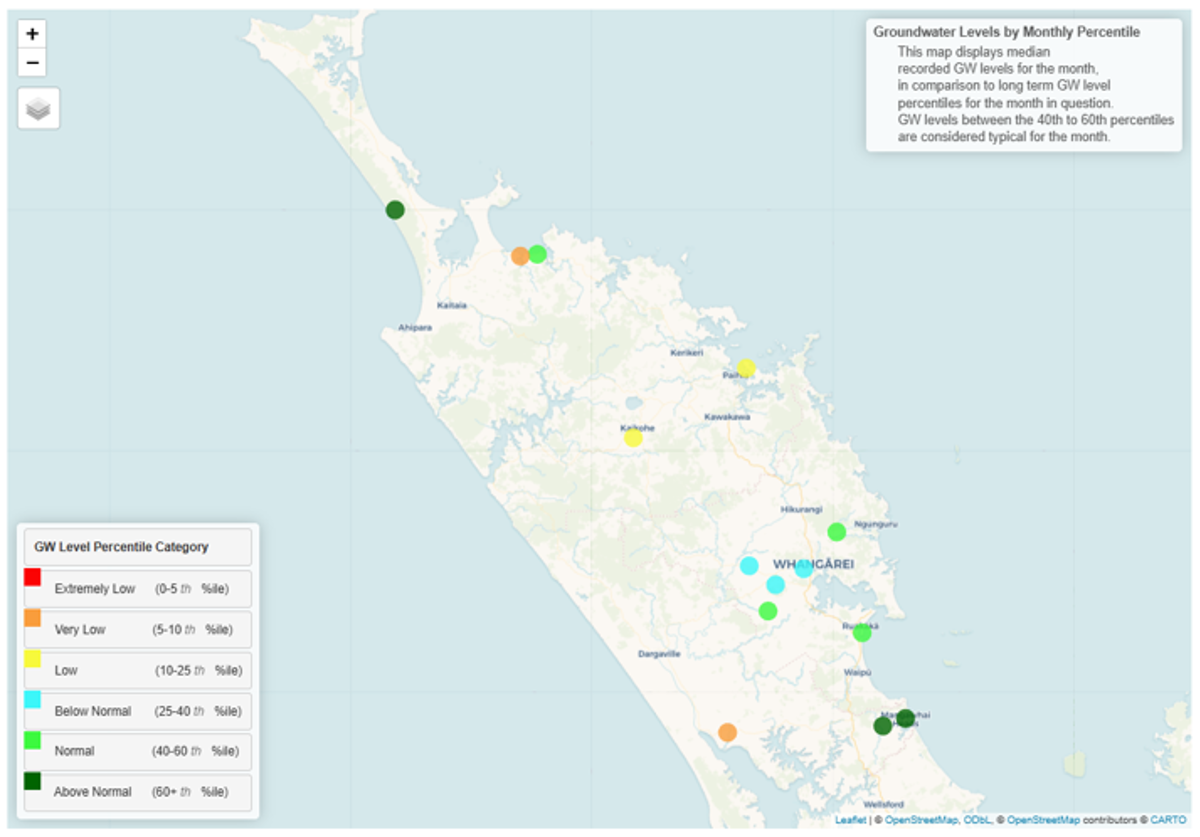
- Groundwater levels are “normal” or “below normal” for most of the region however levels are starting to recede
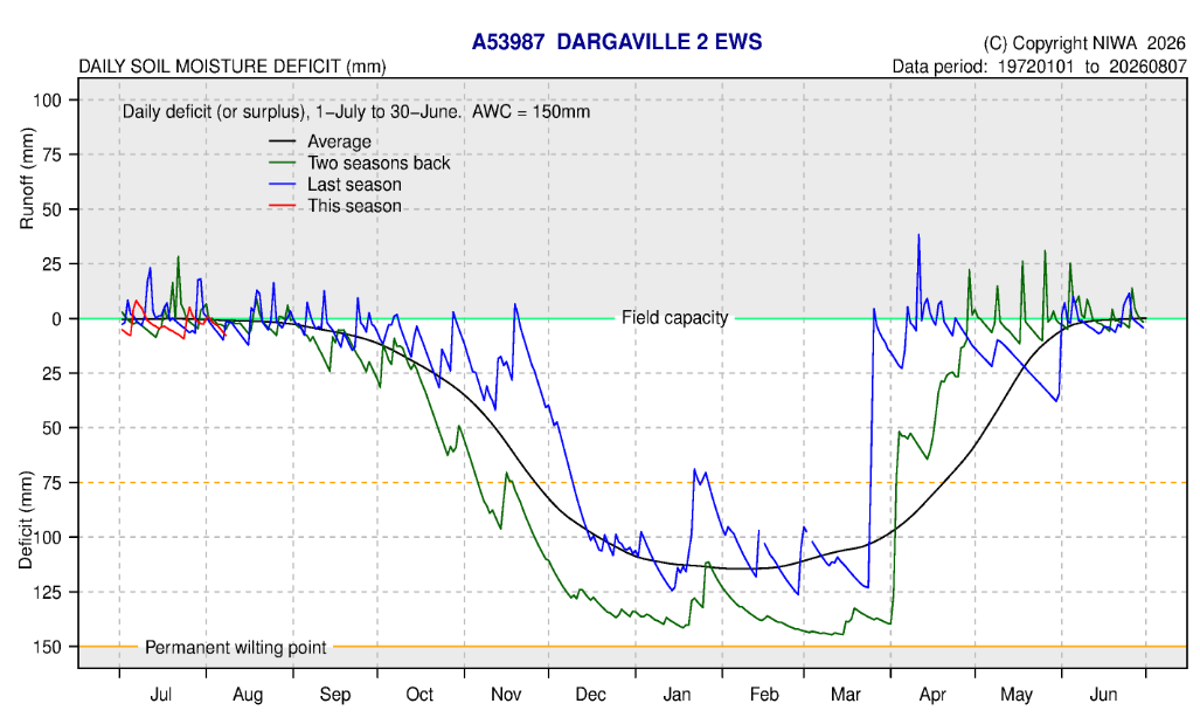
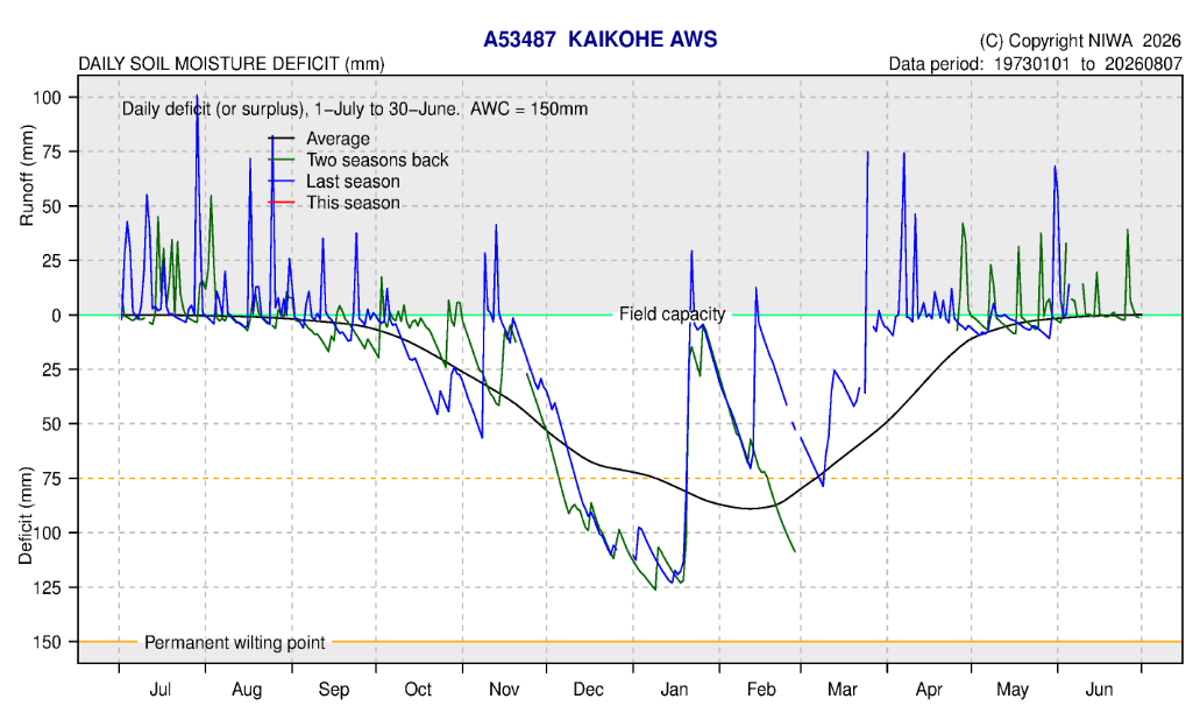
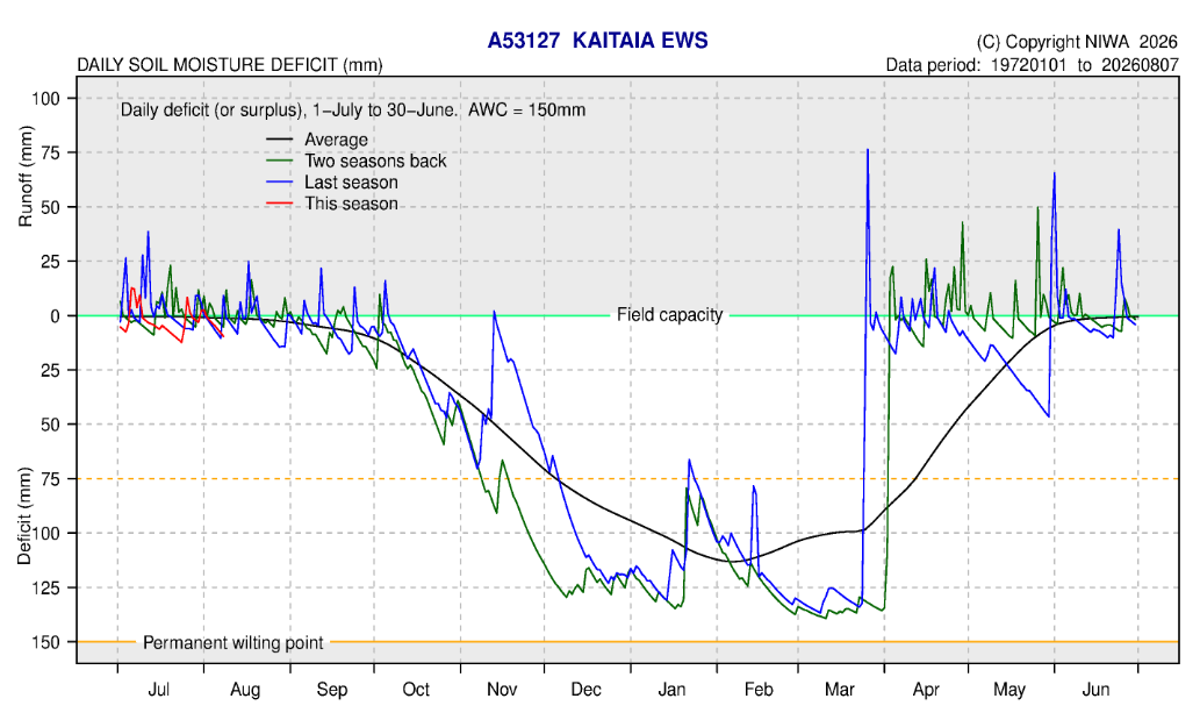
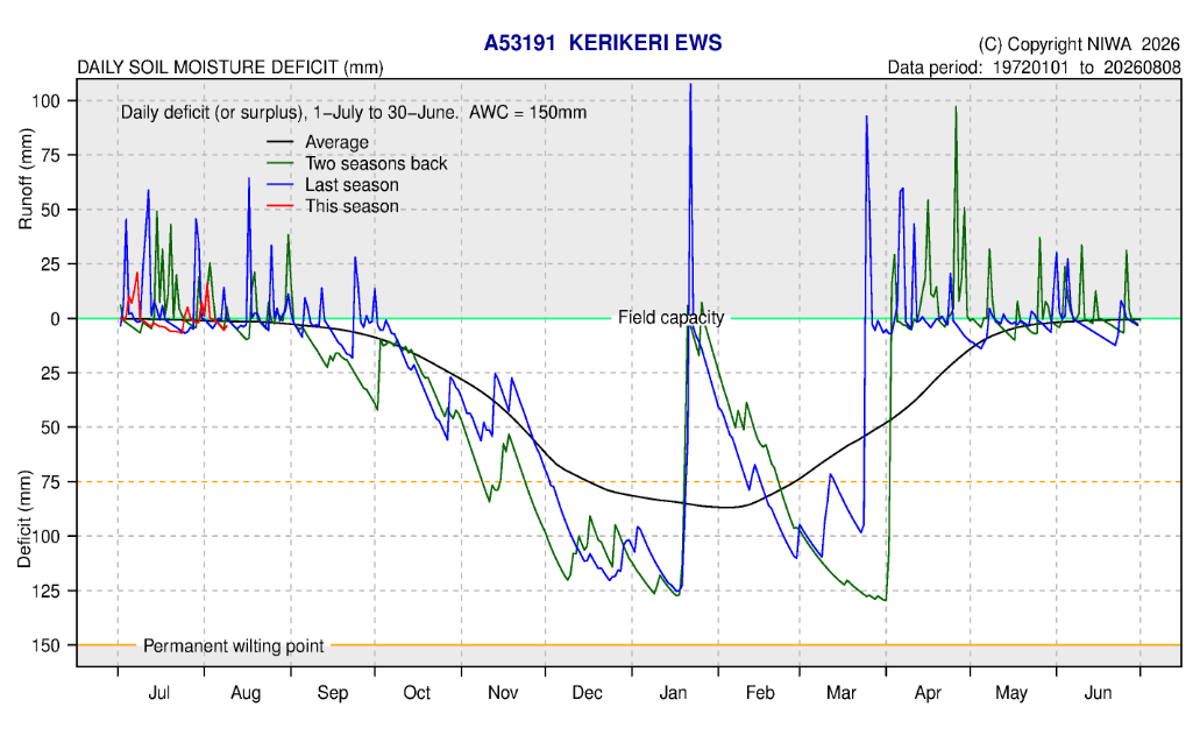
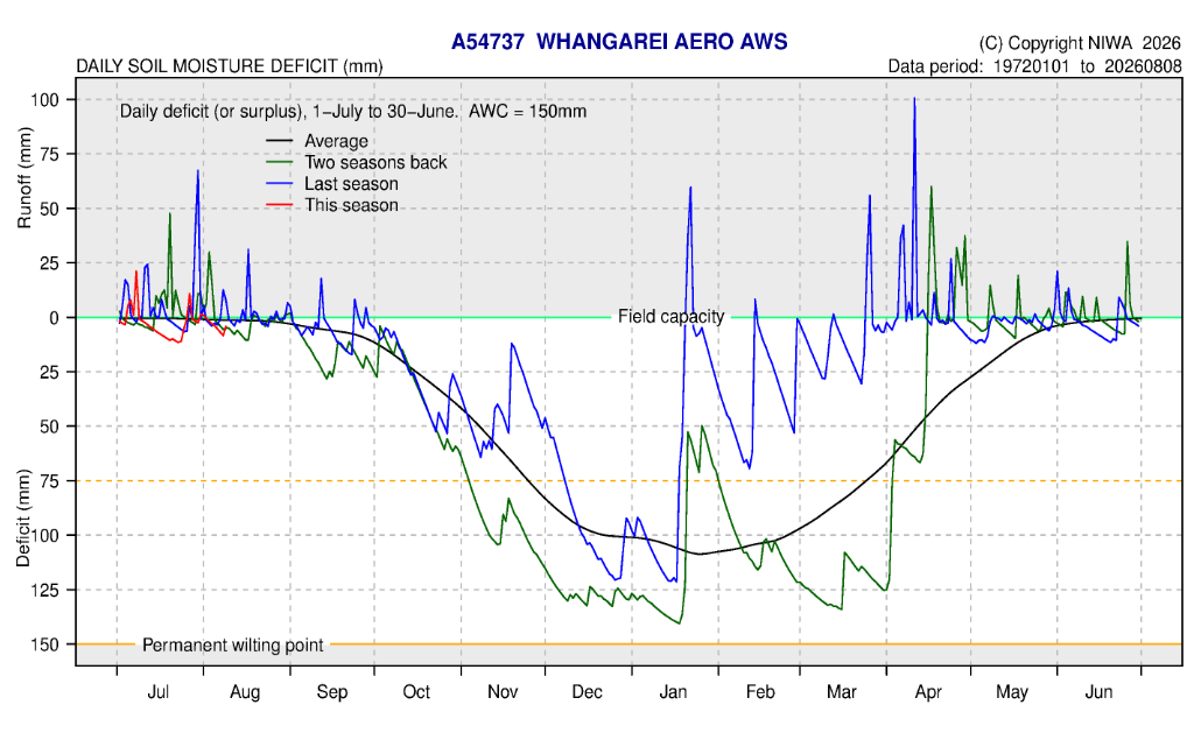
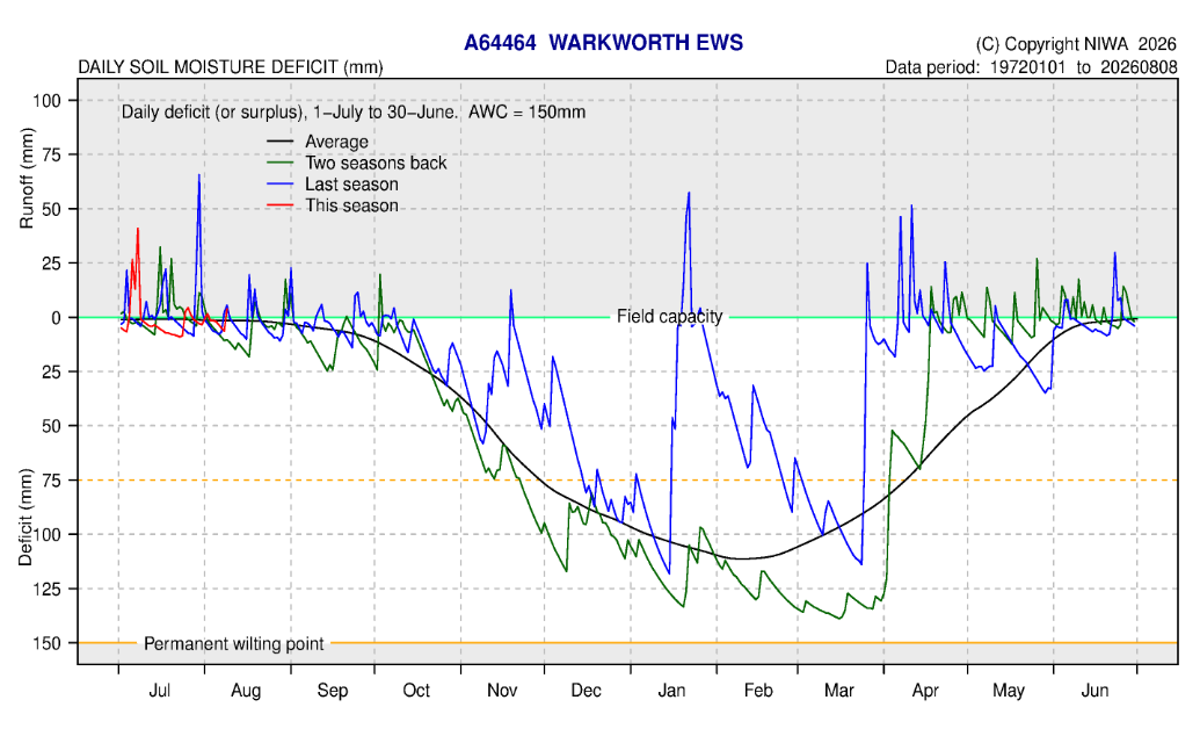
- The region’s soils are starting to dry out with most sites at or just below field capacity
- El Niño conditions have now set in and strengthened during this month; the event remains in its early stages; impacts on Northland’s weather patterns are yet to be fully felt but are anticipated later in the year.
- El Niño typically brings drier weather to Northland.
Rainfall
- Northland’s average rainfall was 95 mm across the region for July (Figure 1), which is 53% of the long-term median, or normal expected rainfall (Figure 2) for the month. Most of this rain was focused around the Eastern Hokianga, Waimamaku and Eastern Coastal areas from Purerua Pensinsula to Whangārei Heads.
- The highest rainfall total for the month was recorded at Waimamaku at Weka Weka Road with 222.5 mm, 71% of normal expected.
- Other high recording rainfall stations include: Waima at Tutamoe with 175mm, 64%; Punaruku at Otetao Reti Marae with 155.5mm, 72%; Takahue at Saddle Road 148.5 mm, 75%; Purerua Pensinsula BOI with 123.4 mm, 117%; Whakapara at Puhipuhi with 123.5mm, 57%; Ngunguru at Dugmores Rock with 110.5mm, 64% of normal expected rainfall for the month.
- The lowest rainfall for July was recorded at Kaipara Harbour at Pouto Point with 44 mm, which is 43% of normal expected rainfall.
Figure 1 and 2: July 2026 rainfall distribution for Northland in mm, and in percentage of median. Showing an average of 95mm (53% of expected) rainfall for the region.
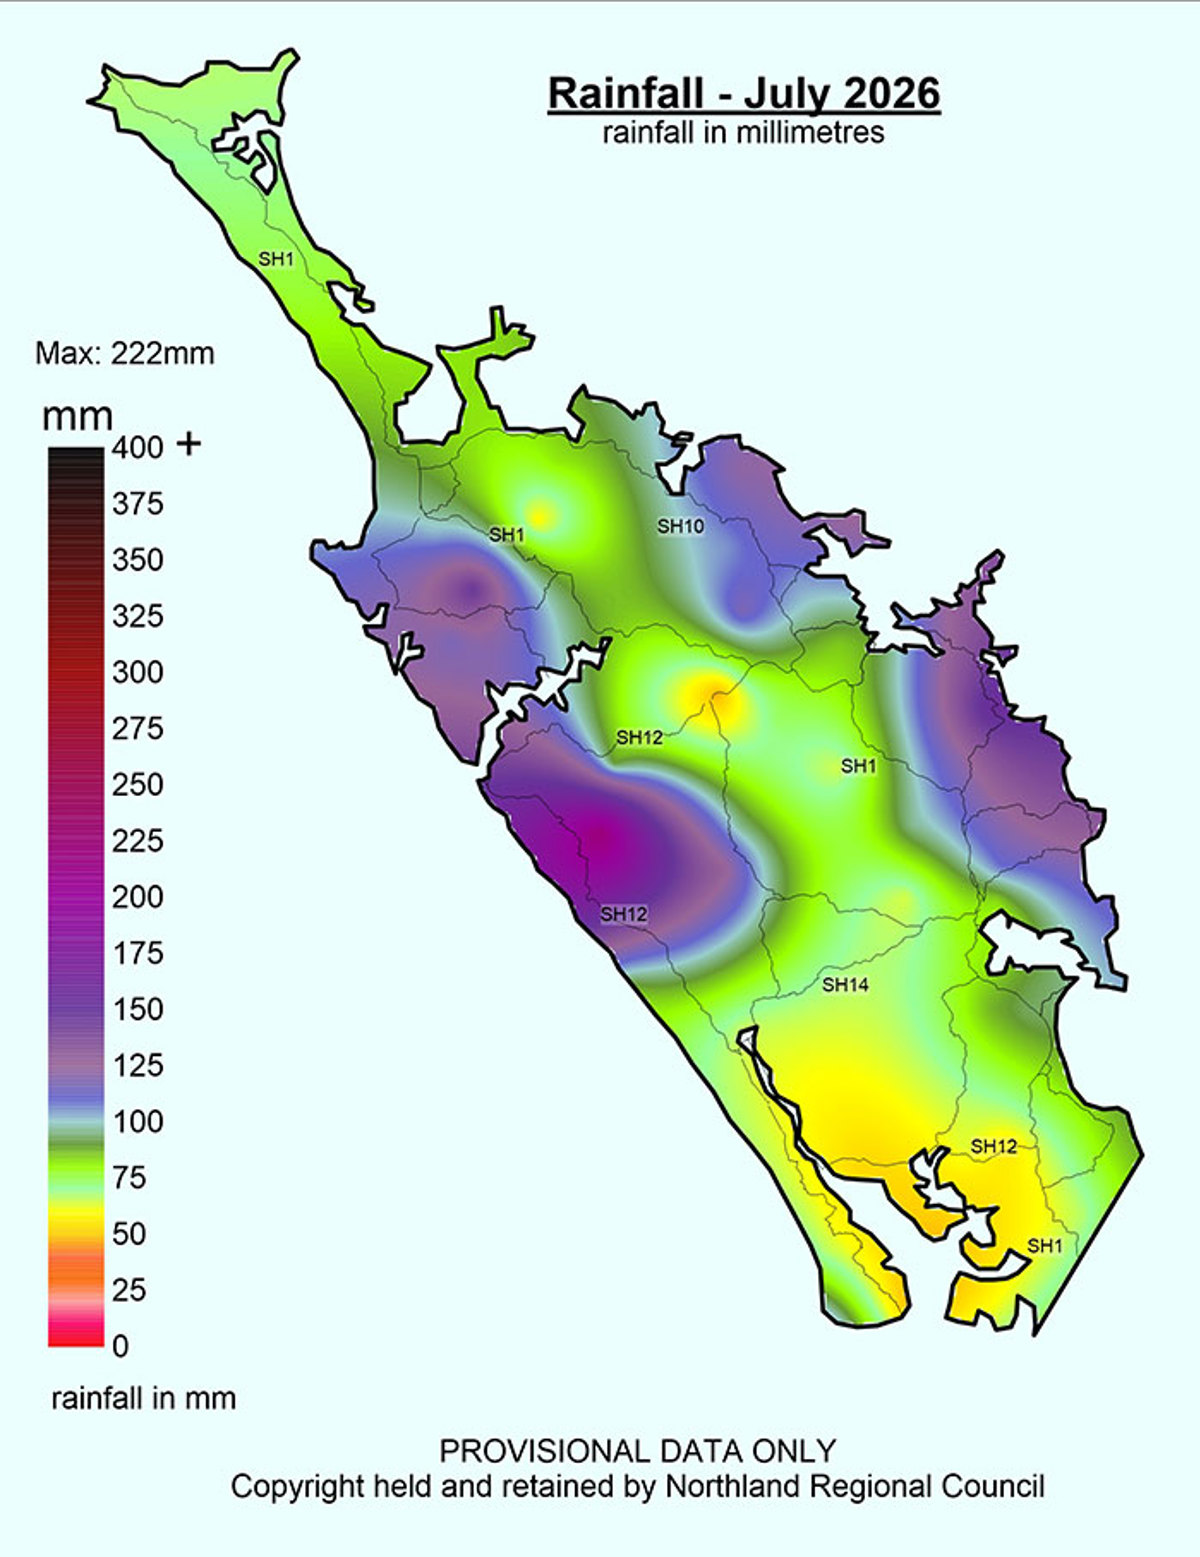
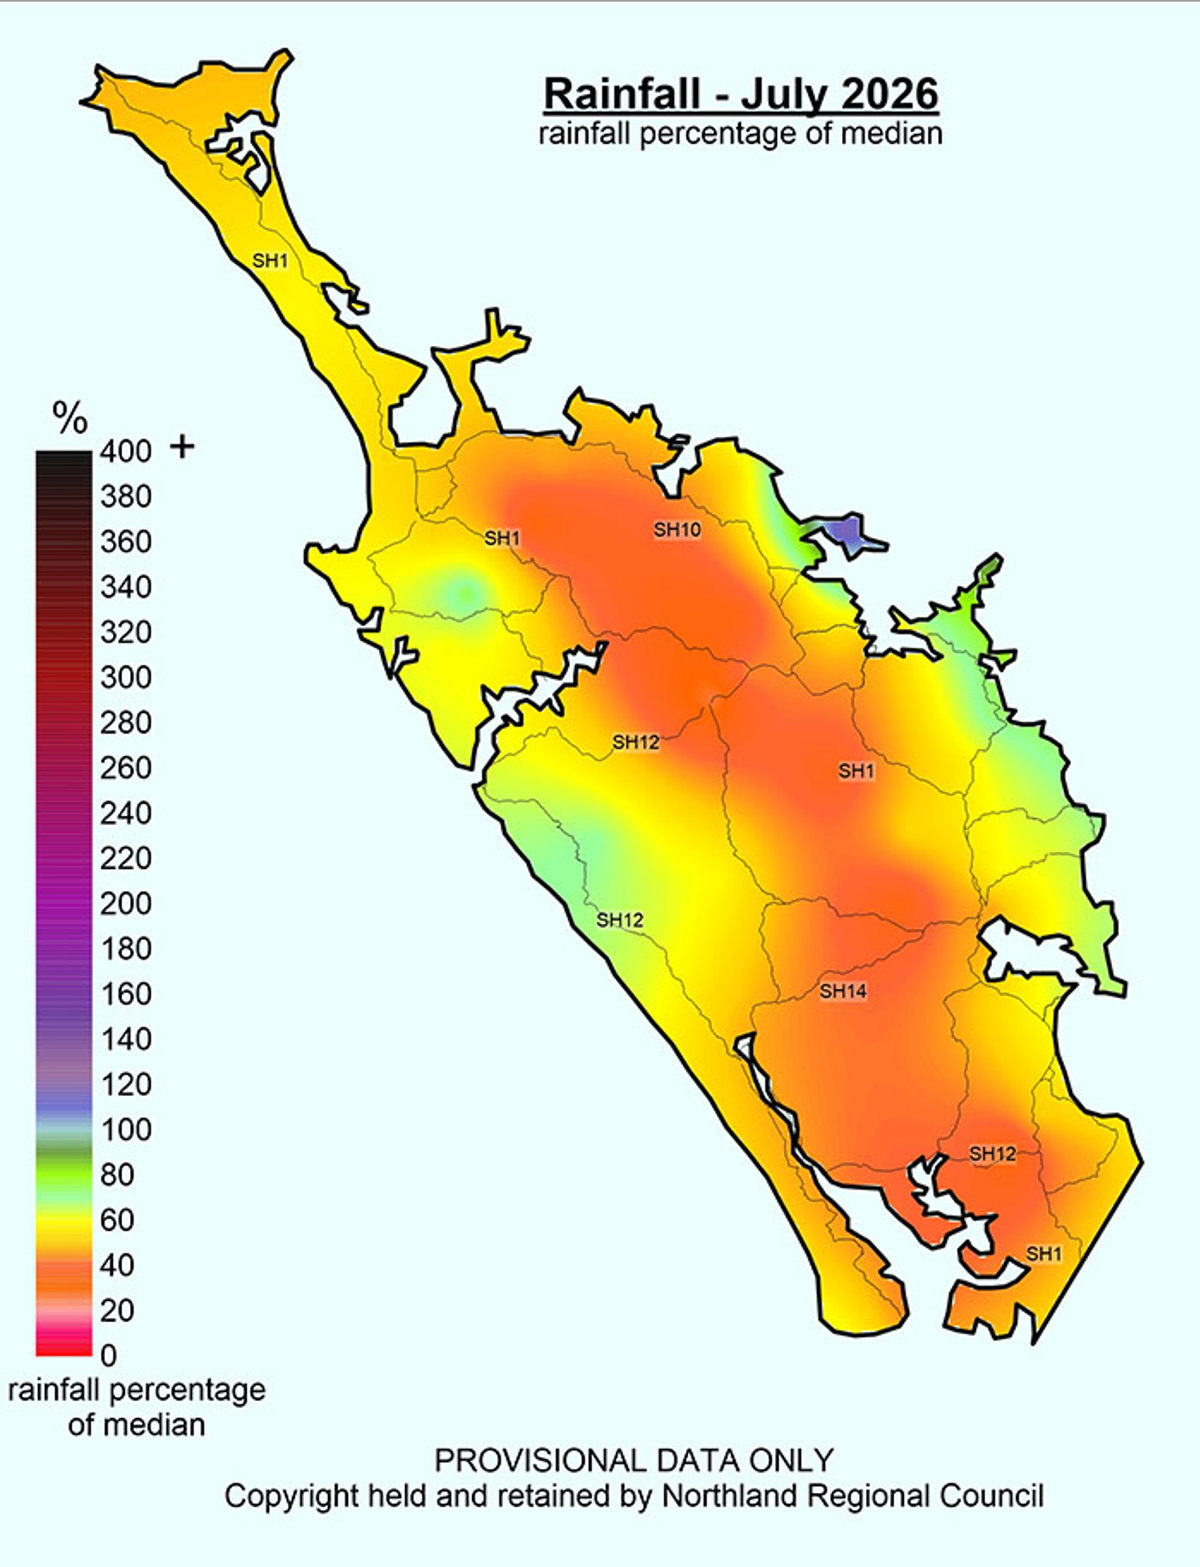
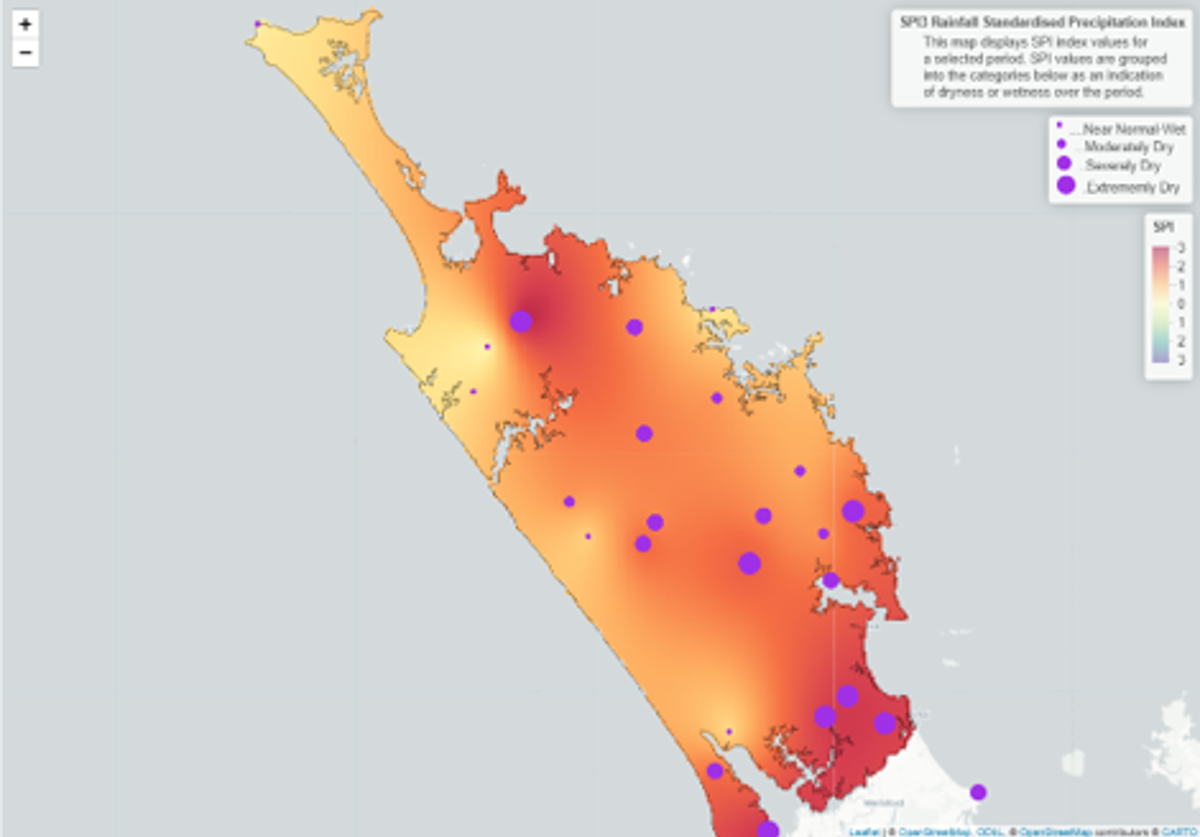
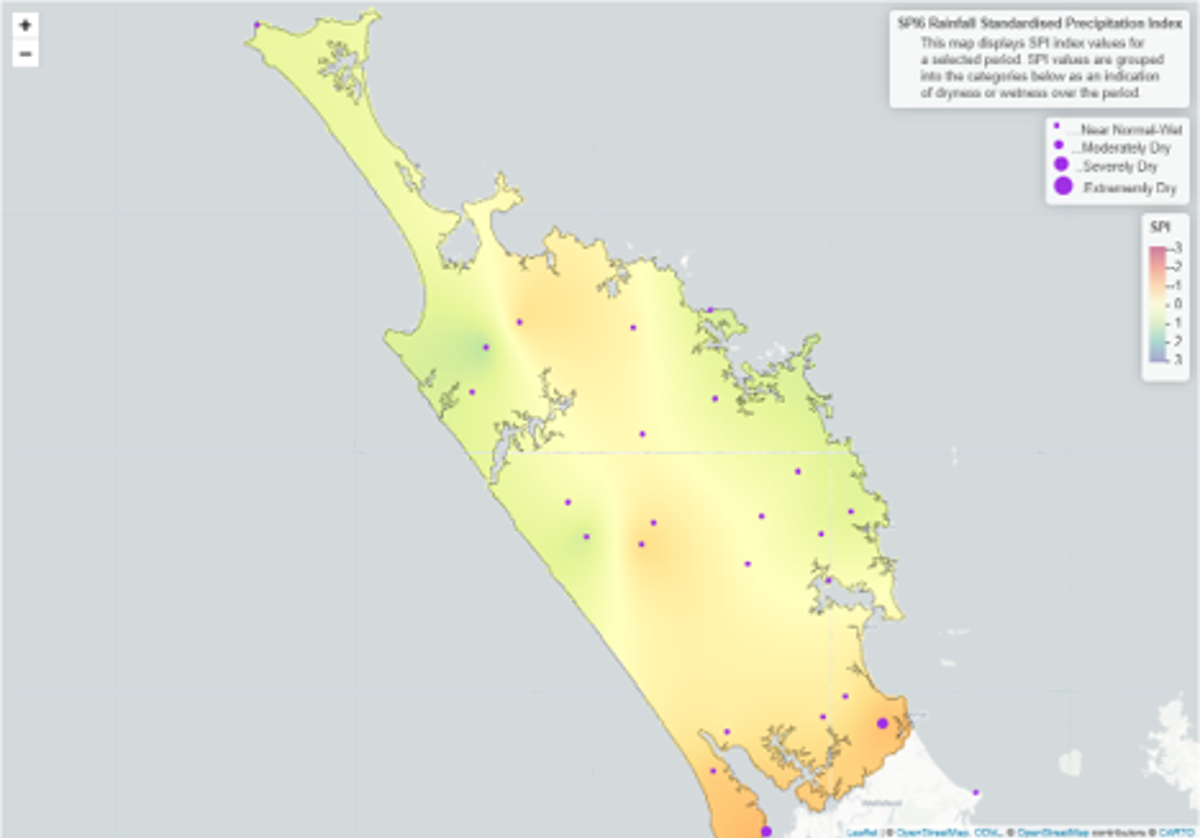
Figure 3 and 4: Standardised rainfall for Northland on a 3-month period May to July 2026 and a 6-month period February to July 2026.
River flows
July river flows for Northland range from “below normal” to “extremely low” across the region. Primarily “low” to “very low”. River flows are generally lower through the middle and southern parts of the region, reflecting July’s lower rainfall distribution.
Figure 5: River flows in Northland for July 2026
Groundwater
Groundwater levels are starting to get less recharge with lower rainfall totals this month. Most levels are “normal” or “below normal” for most of the region for this time of year. The exceptions are Aupouri and Mangawhai where levels are “above normal”; Bay of Islands and Kaikohe are “low” with Taipa and Awaroa where levels are “very low”.
Figure 6: Groundwater levels in Northland’s primary monitored aquifers for July 2026
Soil Moisture
Summary of modelled soil moisture data from Earth Sciences NZ
- The soil moisture deficit is calculated based on incoming daily rainfall (mm), outgoing daily potential evapotranspiration (mm), and a fixed available water capacity (the amount of water in the soil 'reservoir' that plants can use.
- Soil moisture is very close to average and is at, or just below, field capacity throughout Northland. (Kaikohe AWS has had missing data during this period).
Figure 7: Calculated daily soil moisture values at key areas around Northland, courtesy of ESNZ, data ending 31 July 2026
Climate Outlook for August – October 2026
Summary of climate forecasts from Earth Sciences NZ
Seasonal Climate Outlook August - October 2026 | Earth Sciences New Zealand | NIWA
- El Niño conditions persist in the tropical Pacific atmosphere and ocean, according to criteria assessed by Earth Sciences New Zealand. The event by all measures has strengthened over the last month – including the strongest atmospheric measurements on record for July; impacts on New Zealand’s weather patterns are yet to be fully felt but are anticipated during this outlook period.
- El Niño related influences on weather patterns are expected to be more noticeable during the spring season with peak El Niño conditions expected in the summer season.
- Winter is already providing cooler temperature ranges; air flow patterns are expected to continue to tend west or south-westerly. Continued below normal rainfall in Northland is increasingly likely which will translate to below normal groundwater recharge creating challenges for water reliant sectors. There will be periods of active weather including, unusually windy conditions along with notable temperature variability; depending on location and strength of high-pressure systems.
- Temperatures are likely to be near average (45% chance) or above average (40% chance).
- Rainfall totals are most likely to be below average (50% chance).
- Soil moisture levels and river flows are about equally likely to be below average (45% chance) or near average (40% chance).
Table 1: Forecasted likelihood of above, near or below average climate conditions for Northland from August – October 2026.
(Expressed as % likelihood).
| Temperature | Rainfall | Soil moisture | River flows | |
| Above average | 40 | 15 | 15 | 15 |
| Near average | 45 | 35 | 40 | 40 |
| Below average | 15 | 50 | 45 | 45 |